
 Cal. No. W770
 Refine your search
W770
Graphs of power generation amount - "Light Level" screen
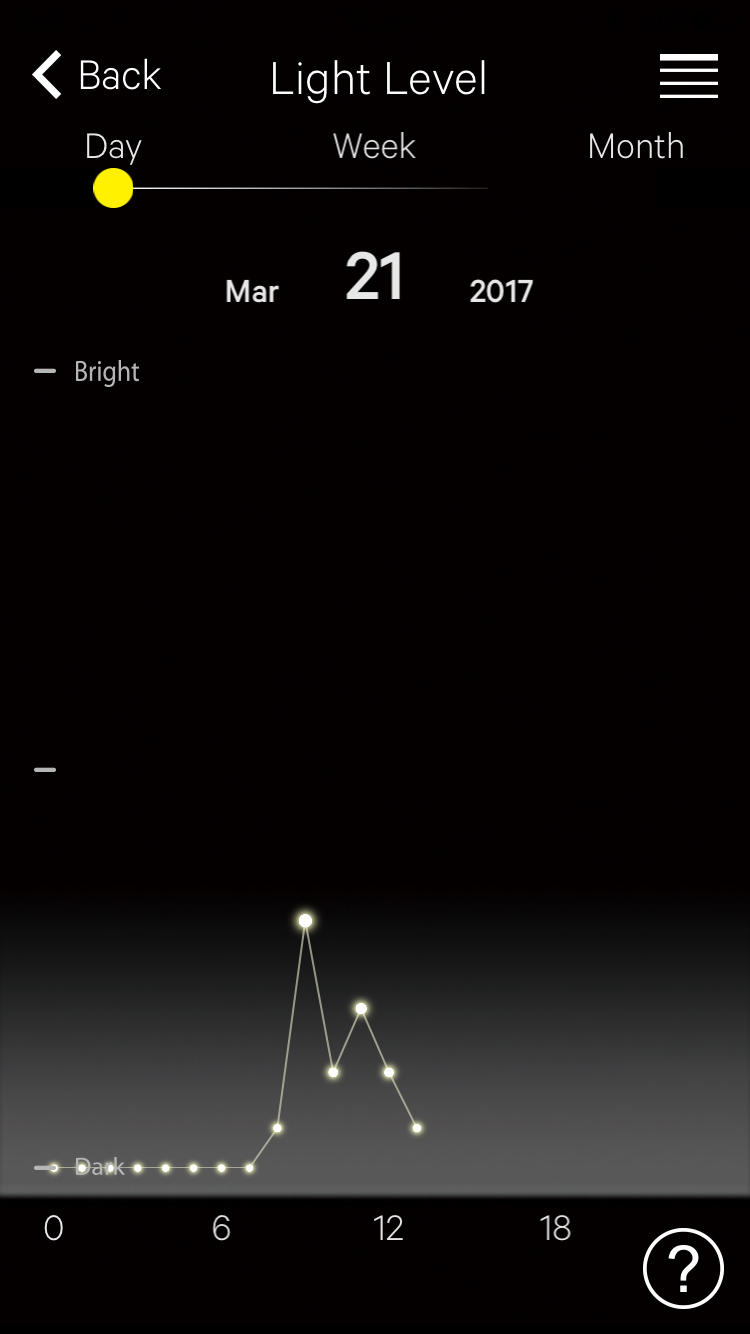
You can see the record of power generation amount of the watch in a line graph on the "Light Level" screen.
Hourly power generation amount of the day is indicated in a line graph when you move the slider on the top of the screen to "Day" or "Week".
When you move the slider to "Month", daily power generation amount is indicated in a line graph and weekly amount in horizontal bar graphs.
!
At the "Week" screen, the slider for selecting the last 7 days also appears.
- Data of power generation amount are stored in the dedicated app.
- Data storing period of the power generation amount varies depending on storage space your smartphone.
- Past power generation data is removed if you remove the dedicated app.
"Day": a line graph of hourly power generation amount of the current day
"Week": line graphs of hourly power generation amount of a day of last 7 days
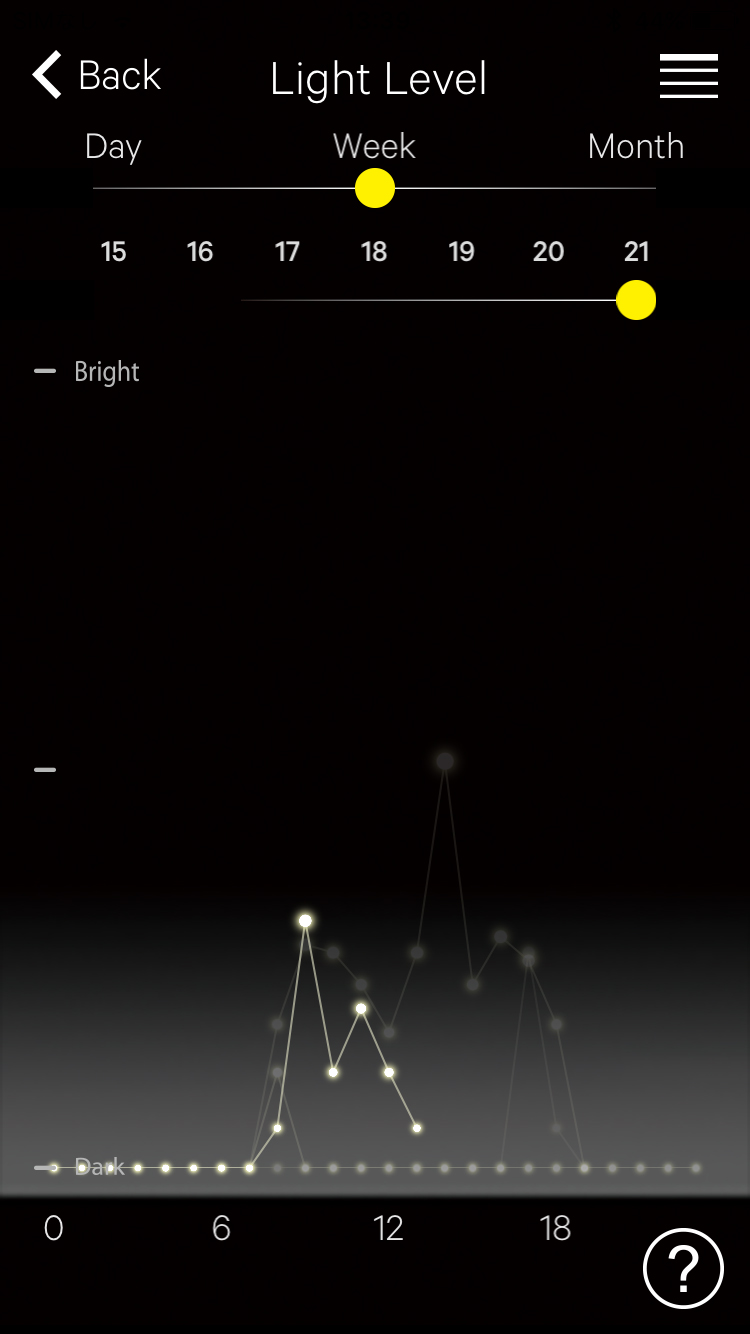
On this screen, graphs of the 15th - 21st days of the month are indicated and selectable, and the graph of the 21st is highlighted.